
What do product analyst interviews ask?
A product analyst interview is built around one skill: using data to help a product team decide what to build and whether it worked. Expect questions on choosing and diagnosing metrics, designing and reading experiments, SQL on event data and funnels, and product sense about what users want. Interviewers watch whether you connect a number to a user behavior and a decision, not whether you can recite a metric definition.
Product Analyst interview questions, by round
20 questions across 5 rounds.
Recruiter and background screen
Finds out what product work you have supported and how close you were to the team making decisions.
- Tell me about a product decision your analysis influenced.
- Which product do you use most, and what is one thing you would change using data?
- What is the difference between supporting a product team and reporting to one?
- How do you work with a product manager who already has an opinion about the answer?
Metrics and product sense
Tests whether you can define success for a feature and notice when a metric is misleading.
- How would you define success for a new search feature?
- A subscription app wants one north star metric. What would you propose and what could go wrong with it?
- Daily active users are up but revenue is flat. What could explain that?
- Which guardrail metrics would you watch when a team optimizes for sign-ups?
- How would you decide whether to sunset a rarely used feature?
Experimentation
Covers designing a test, choosing a unit and metric, and interpreting a messy result.
- Design an experiment to test a new checkout button.
- The test shows a lift for new users and a drop for existing ones. What do you do?
- How do you decide how long to run a test?
- What can go wrong if users in the test can interact with each other?
SQL and event data
Queries over event tables: funnels, retention, cohorts and sessions.
- Write a query for the conversion rate at each step of a signup funnel.
- Compute week-one retention for users grouped by signup week.
- How would you define a session from raw click events?
- How do you handle a user who completes a step twice?
Behavioral and influence
A product analyst depends on influence, since the decision belongs to someone else.
- Tell me about a time the data disagreed with the product plan. What happened?
- Describe how you present a result you are unsure about.
- Tell me about an analysis that turned out to be wrong.
Sample answers
Illustrative answers written for this guide, not transcripts of real candidates.
How would you define success for a new search feature?
I would start from what the feature is for: helping users find something they came for faster. So my main metric would be the share of searches that end in a click on a result and then a meaningful action, such as opening or buying the item, within the same session. Supporting metrics would be searches with no results, searches that are reworded straight away, which suggest the first results were poor, and time from search to action. Guardrails would be page load time and overall conversion, in case search pulls people away from browsing that already worked. I would not use number of searches as the goal, because a bad search that makes people search three times raises it. Before launch I would set what result would make us change course, and compare against users who did not get the new feature.
Why it scores: Problem-Solving: ties the metric to the purpose of the feature. Technical: pairs a primary metric with diagnostic and guardrail metrics. Communication: names the metric that would mislead and why.
The test shows a lift for new users and a drop for existing ones. What do you do?
I would first check that the result is not a quirk: whether the split was randomized within each group, whether each group is large enough to read and whether I looked at many segments and found one by chance. If it holds up, a mix like this often means a real trade-off. For example, a simplified screen helps people who have never seen it and gets in the way of regular users who had a habit. Then the question is what each group is worth to the business, and whether we can show the change only to new users. I would also check how long the existing users were exposed, since a drop for them can be a short change effect that fades. I would not just report the average, because it would hide both effects. I would recommend a rollout to new users and a follow-up test for the rest.
Why it scores: Technical: checks randomization, sample size and multiple-comparison risk before explaining the result. Problem-Solving: offers a mechanism and a decision. Communication: refuses to hide two opposite effects in an average.
Write a query for the conversion rate at each step of a signup funnel.
I would clarify the events first: say a visit, an account created, a profile completed and a first action, and whether a user has to do them in order within a time window. I would build one row per user with the first time they hit each step, using conditional aggregation on the events table, grouped by user, so a user who repeats a step is only counted once. Then I count users who reached each step, requiring the later timestamp to be after the earlier one so the funnel respects order. The rate at each step is users at that step divided by users at the previous step, and I would also show the overall rate from the first step. I would check that the first step count matches the number of distinct visitors from another source, and watch for bots and internal test accounts inflating the top of the funnel.
Why it scores: Technical: one row per user with ordered steps avoids double counting. Code Quality: validates the total against another source and excludes test traffic. Problem-Solving: states the definitions before writing the query.
Tell me about a time the data disagreed with the product plan. What happened?
A product manager planned to promote a new recommendations module to the top of the home page because early usage looked high. When I looked at what happened after the click, users who used it returned less often over the next weeks than similar users who did not. I did not tell her the plan was wrong. I showed her the comparison, said what I was unsure about, such as people who like recommendations might simply differ from others, and suggested a small test to settle it. She agreed to run it before the promotion. The test showed no benefit, and the team improved the quality of the recommendations first. What I learned is to bring the product manager the evidence early, in private, with a next step, and not in a review meeting.
Why it scores: Behavioral: influences a decision belonging to someone else without a confrontation. Technical: acknowledges selection bias in the comparison. Communication: pairs a finding with a proposed test and an honest caveat.
What a Product Analyst answer is scored on
- Problem-Solving
- Connecting a metric to a user behavior and a decision, diagnosing a movement in a number, and choosing what to measure next.
- Code Quality
- Event-data queries that count users once, respect step order and time windows, exclude test traffic and can be reread by a colleague.
- Technical
- Experiment design, interpretation of lifts and segments, retention and funnel logic, and knowing the common ways a comparison misleads.
- Communication
- Presenting a result to a product team: the recommendation first, the uncertainty stated plainly, and no jargon that hides the point.
- Behavioral
- Working with people who own the decision, handling data that contradicts the plan and admitting when an analysis was wrong.
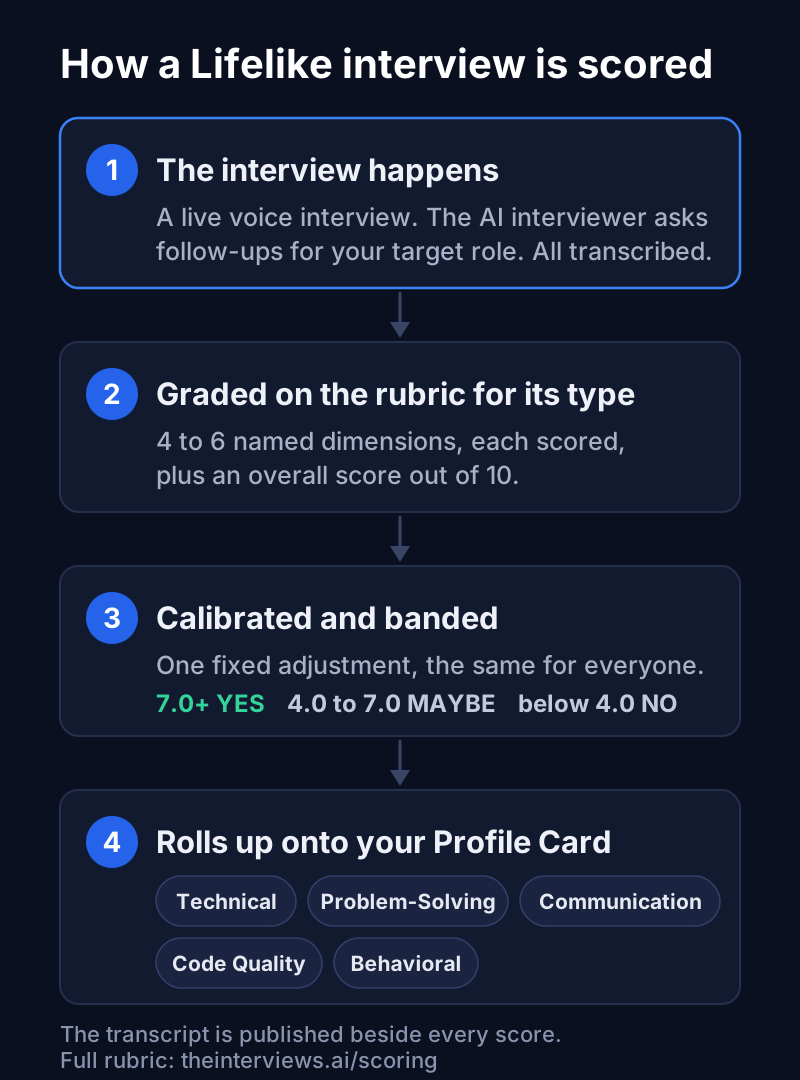
These are the five dimensions every interview rolls up to. The full rubric and its measured limits are on the scoring page.
How a Lifelike Product Analyst interview is scored
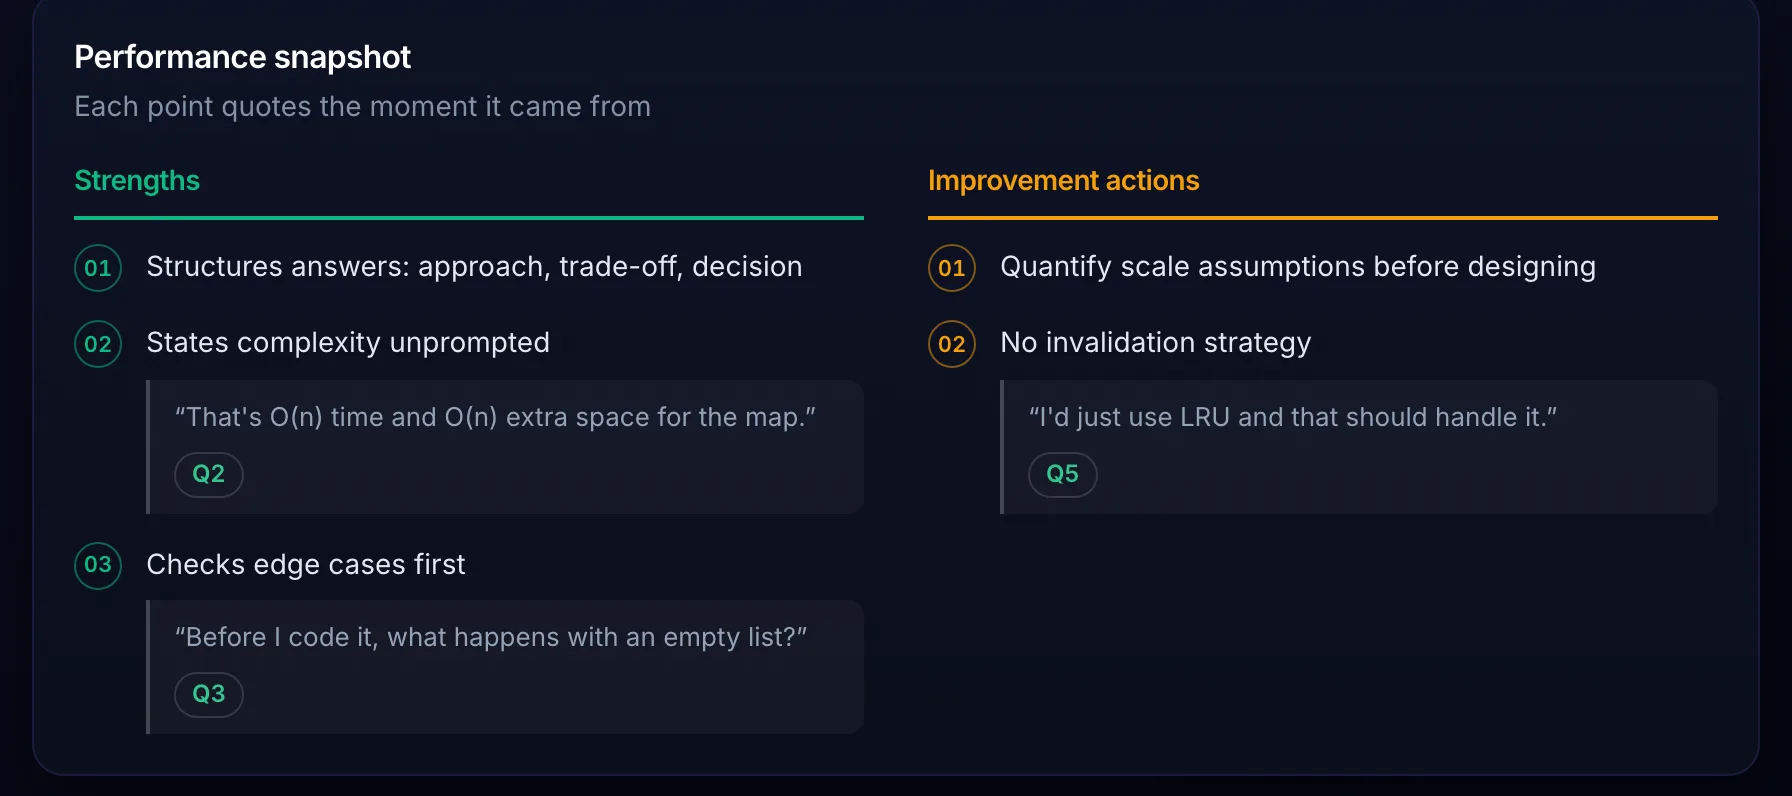
What the report shows you
How to prepare
- Choose a product you know well and write its primary metric, two supporting metrics and two guardrails, with the reason for each.
- Practise funnel, retention and cohort queries on event-style data and always dedupe to one row per user per step.
- Learn the failure modes of experiments: peeking, too many segments, interference between users, novelty effects.
- For every metric you propose, say how it could be gamed and what would reveal it.
- Bring one story where your analysis changed or stopped a product decision, told with the caveats you gave at the time.
Product Analyst interviews: common questions
What is the difference between a product analyst and a data analyst?
A product analyst sits with a product team and works on product questions: metrics, experiments, funnels and retention. A data analyst role can span any part of a business. The interviews overlap in SQL and statistics but a product analyst interview adds more product sense.
Will I be asked to run a statistical test by hand?
Rarely. You are more likely to be asked what a test result means, what could be wrong with it and what you would decide, than to compute a statistic from a formula.
How do I answer a metrics question when I do not know the product?
Ask what the product is for and who uses it, state your assumptions, then build the metric from the user goal. Interviewers prefer a stated assumption over a confident guess.
How do I practise?
Run a mock interview for the Product Analyst role and answer out loud. The feedback report scores each answer on the five dimensions above and shows the transcript beside the score.