
What do data analyst interviews ask?
A data analyst interview usually combines a SQL exercise, some applied statistics, a case where you turn a vague business question into an analysis, and questions about explaining findings to people who are not analysts. The technical bar is mostly joins, aggregation and window functions plus sound judgment about data quality. What separates candidates is whether they ask what decision the analysis supports before they write a query, and whether they say how sure they are of the answer.
Data Analyst interview questions, by round
20 questions across 5 rounds.
Recruiter and background screen
Checks which tools you have genuinely used and what kind of analysis you have done, as opposed to dashboards you have only viewed.
- Describe an analysis you did that changed a decision. What was the decision?
- Which tools do you use for analysis, and what would you pick for a one-off question versus a recurring report?
- Tell me about a time the data you were given turned out to be wrong.
- How do you keep your work reproducible when a colleague needs to rerun it?
SQL exercise
Live or take-home queries on a small schema. Correctness matters, and so does noticing what the data will do to your result, such as duplicates and nulls.
- Return the top three customers by revenue in each region.
- Compute the share of users who placed a second order within thirty days of their first.
- What is the difference between INNER JOIN, LEFT JOIN and a join that fans out rows? How do you detect fan-out?
- Find users who logged in on three consecutive days.
- How would you remove duplicate rows from a table but keep the most recent one?
- Why might COUNT(*) and COUNT(column) differ, and when does that matter?
Statistics and experimentation
Applied reasoning rather than formulas: can you tell when a difference is likely to be noise, and when a comparison is unfair?
- Conversion rose after a redesign. How do you decide whether the redesign caused it?
- Explain a p-value to a product manager who has never heard of one.
- The average and the median of order value disagree. What does that tell you?
- When would you not run an A/B test even if you could?
Case analysis
An open question with no single answer. The interviewer watches how you frame it, what data you ask for and how you narrow it down.
- Weekly active users fell this week. How do you investigate?
- How would you measure whether a new onboarding flow is working?
- Which metrics would you put on a dashboard for a support team, and which would you leave off?
Communication and stakeholders
Checks that you can turn analysis into something a decision-maker will act on.
- Explain a technical finding to a stakeholder who wants a yes or no.
- A senior stakeholder disagrees with your result. What do you do?
- Tell me about a time you said no to an analysis request.
Sample answers
Illustrative answers written for this guide, not transcripts of real candidates.
Return the top three customers by revenue in each region.
I would first ask whether revenue means gross order value or net of refunds, and whether ties should all be kept. Assuming net, and a tie should be broken consistently, I sum revenue per customer and region in a CTE, then rank within each region using a window function: DENSE_RANK or ROW_NUMBER over the revenue summed, partitioned by region and ordered by revenue descending. Then I filter the rank to three or less in an outer query, since I cannot filter on a window function in the same level. I would use ROW_NUMBER if the business wants exactly three rows per region, and DENSE_RANK if a tie for third place should include both customers. Before I trust it, I would check that the number of regions matches the region table, and that a customer with no orders does not appear with a null.
Why it scores: Technical: the window function is chosen and the ROW_NUMBER versus DENSE_RANK trade-off is explained. Problem-Solving: clarifies the definition of revenue before writing. Code Quality: separates the aggregation from the ranking and sanity-checks the output.
Weekly active users fell this week. How do you investigate?
Before slicing anything I check whether the drop is real: has the definition of active changed, did a tracking event stop firing after a release, is there a data pipeline delay, and is this week unusual because of a holiday or an outage? If it is real, I split the drop by the dimensions most likely to explain it: platform, country, new versus returning users and acquisition channel. A drop concentrated in one app version points to a bug, one channel points to a change in spend, and returning users only points to a product problem. I would compare to the same week in earlier periods to account for seasonality. At the end I would say what I found, how confident I am, and what I would check next, rather than a single confident cause I cannot prove.
Why it scores: Problem-Solving: rules out measurement error before inventing a business story. Technical: chooses segments that separate hypotheses. Communication: ends with confidence and next steps, which is what a stakeholder needs to act.
Conversion rose after a redesign. How do you decide whether the redesign caused it?
A before-and-after comparison is weak evidence, because anything else that changed in that period gets credited to the redesign: a campaign, seasonality, a different mix of visitors. If it can be done, the clean answer is a randomized test where some visitors see the old page at the same time. If it was already launched to everyone, I would look for a comparison group that was not exposed, such as a region or platform that got it later, and check that the traffic mix did not shift. I would also check that the metric I am reading is the one the redesign was meant to move. Then I would report the size of the difference with a range, say what the evidence can and cannot support, and recommend a holdback test if the decision is expensive to reverse.
Why it scores: Technical: identifies confounders and names a valid way to separate them. Communication: reports an effect with its uncertainty and does not overclaim. Problem-Solving: offers a fallback design when the ideal experiment is not available.
Tell me about a time the data you were given turned out to be wrong.
I was building a retention report from an events table and my numbers for a segment looked too good. Before presenting, I checked and found the same user appearing under two ids because the app generated a new anonymous id after a login, so some users were counted as new twice and some retained users were missed. I told the product manager the same day instead of waiting for the meeting, showed the example users, and asked the engineer who owned tracking how ids were assigned. We agreed to join on the account id where one existed, I marked the earlier weeks as approximate, and I added a check to the report that flags users with more than one anonymous id. The report went out a day late but with numbers I could defend.
Why it scores: Behavioral: owns a problem and communicates it early instead of hiding it. Technical: names a precise cause in the data model, not just that the data was bad. Code Quality: leaves a check behind so the problem does not recur.
What a Data Analyst answer is scored on
- Problem-Solving
- Framing an open question, choosing the data that separates hypotheses, and ruling out measurement error before telling a business story.
- Code Quality
- Readable, reproducible queries: CTEs with clear names, no accidental row fan-out, sanity checks on totals, and work another analyst can rerun.
- Technical
- SQL fluency including window functions and joins, correct basic statistics, and an understanding of bias, confounding and sample size in plain language.
- Communication
- Explaining findings to non-analysts, leading with the answer, and stating how confident you are and what the data cannot tell you.
- Behavioral
- How you handle bad data, pushback from stakeholders and requests you should decline, shown through specific events from your own work.
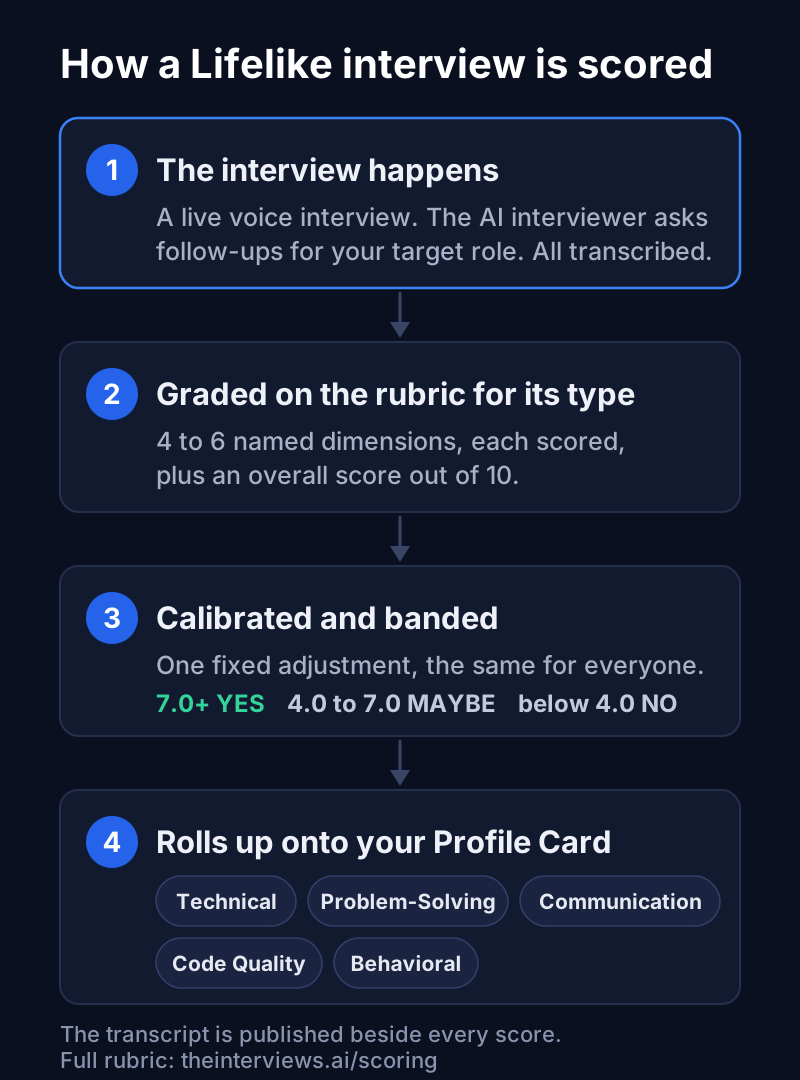
These are the five dimensions every interview rolls up to. The full rubric and its measured limits are on the scoring page.
How a Lifelike Data Analyst interview is scored
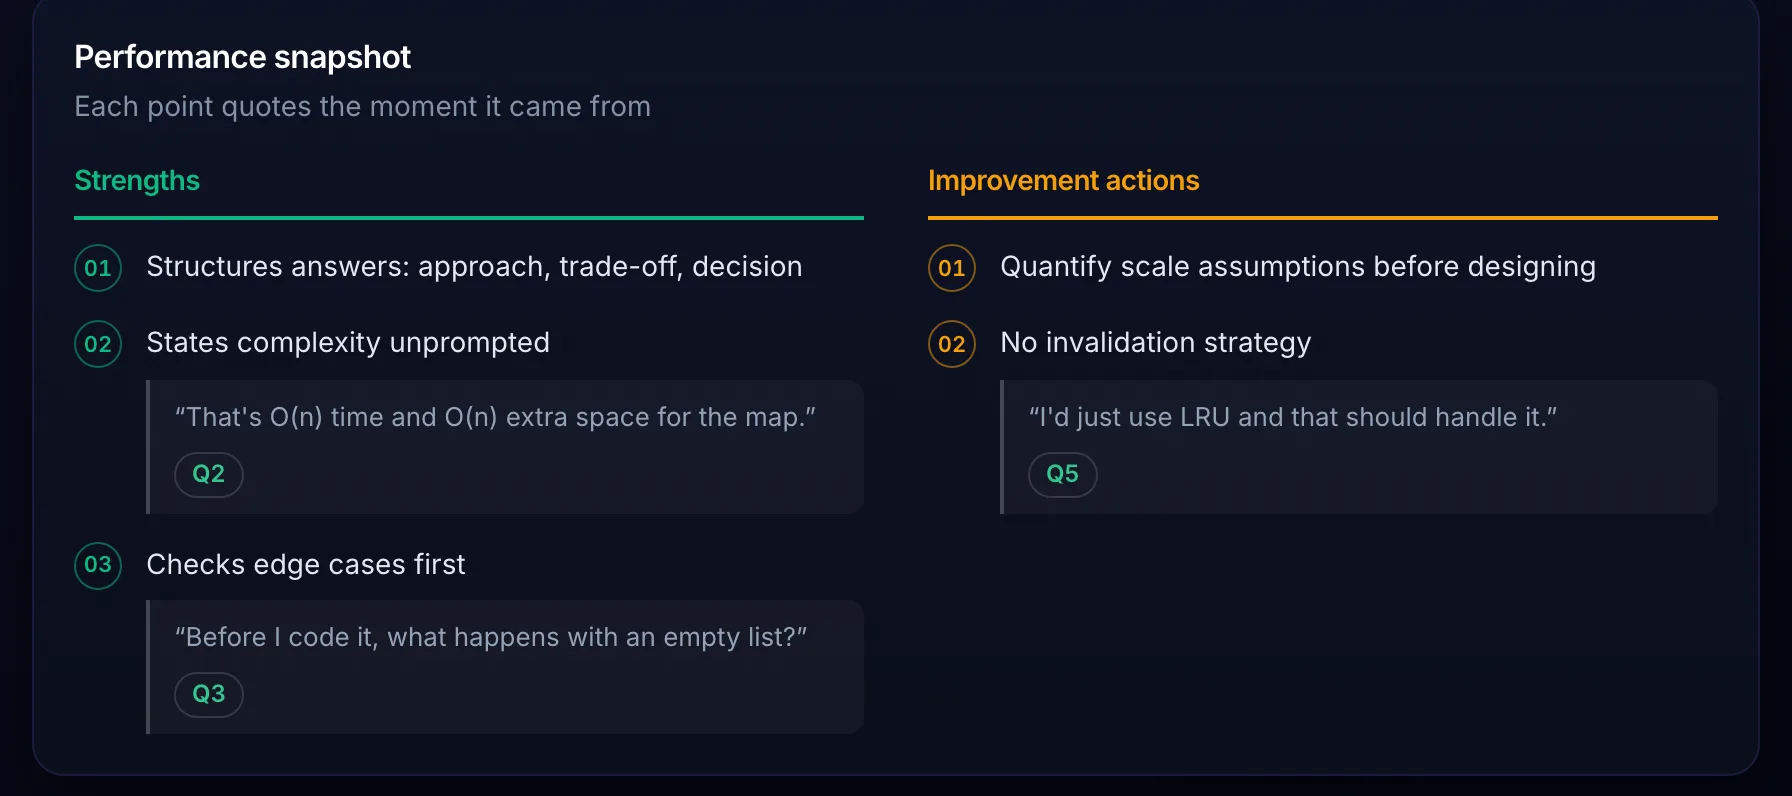
What the report shows you
How to prepare
- Practise window functions, conditional aggregation and self-joins on a small dataset until you can write them without looking anything up.
- For every query you write, say out loud what one row of the result represents and how you would check for duplicates.
- Prepare two analyses from your own work with the decision they informed. If you have no job experience, use a course or public dataset and say what you would have recommended.
- Rehearse an investigation framework for a metric that moved: is it real, where is it concentrated, what changed.
- Practise saying a finding in two sentences with the recommendation first and the caveat second.
Data Analyst interviews: common questions
How much SQL do data analyst interviews require?
Enough to write joins, aggregations and at least basic window functions without help. Most interviews have a live or take-home SQL exercise, and they care about whether you check the result as much as whether you can write the query.
Do I need to know machine learning?
For most analyst roles, no. Solid descriptive statistics, comparing groups and the basics of experiments matter more. Machine learning is more commonly asked in data scientist interviews.
Should I use Python or Excel in a case exercise?
Use what you are accurate in, and say why. A clean spreadsheet with clear assumptions can beat sloppy code. What interviewers want is a reproducible process, checks on the result and a clear recommendation.
How do I practise?
Run a mock interview for the Business Intelligence Analyst role, the closest analytics role in the practice catalog, and answer out loud. The feedback report scores each answer on the five dimensions above.